Three published readings of southeast asia ecommerce gmv are routinely placed in the same chart, and they do not describe the same thing. e-Conomy SEA 2026 puts digital economy GMV at US$368 billion for 2026, up 17 per cent, with ecommerce at US$226 billion, up 18 per cent. Momentum Works records 2025 platform ecommerce GMV at US$157.6 billion, up 22.8 per cent, and forecasts content commerce at US$77.9 billion for 2026. This article takes five Southeast Asian markets as its subject and does not assess any single market. The ten-economy coverage of e-Conomy SEA 2026 and the six-market coverage of Momentum Works are cited only as statements of statistical scope.
Indonesia, Malaysia and Thailand are within that subject scope.
Vietnam and the Philippines complete the five. Neither coverage line is used here to assess a single market.
A 2026 forecast and a 2025 actual are different periods. A platform figure and a digital-economy figure are different boundaries.
Content commerce is a subset of platform GMV.
Where the three channels actually sit
The working split in the published material is functional. Shelf-based platform search handles demand that already exists, where a shopper arrives with a product category in mind. Content commerce covers livestreams, short video and affiliate marketing, and it generates demand before a search happens. Owned storefronts appear in the reporting as a retention and inventory-synchronisation requirement, without a separate GMV line. Tech Collective’s 5 November 2026 account of 2027 planning describes three formats with distinct jobs: short video builds awareness, livestreams carry demonstration and question handling, and affiliate links reach audiences a brand already has.
That division explains why the phrase channel split misleads when it is read as a market-share table. A single order can pass through a short video, a livestream, a product page and an affiliate link, with the reporting system assigning the sale to one of them. Momentum Works’ 8 September 2026 note on Live Commerce in Southeast Asia 2026 states that not all livestream GMV is incremental, since part of it moves from product pages, short video and affiliate traffic. It asks operators to measure incremental revenue, conversion and acquisition cost instead of view counts or livestream GMV alone.
Attribution is an accounting choice, not a new pool of demand.
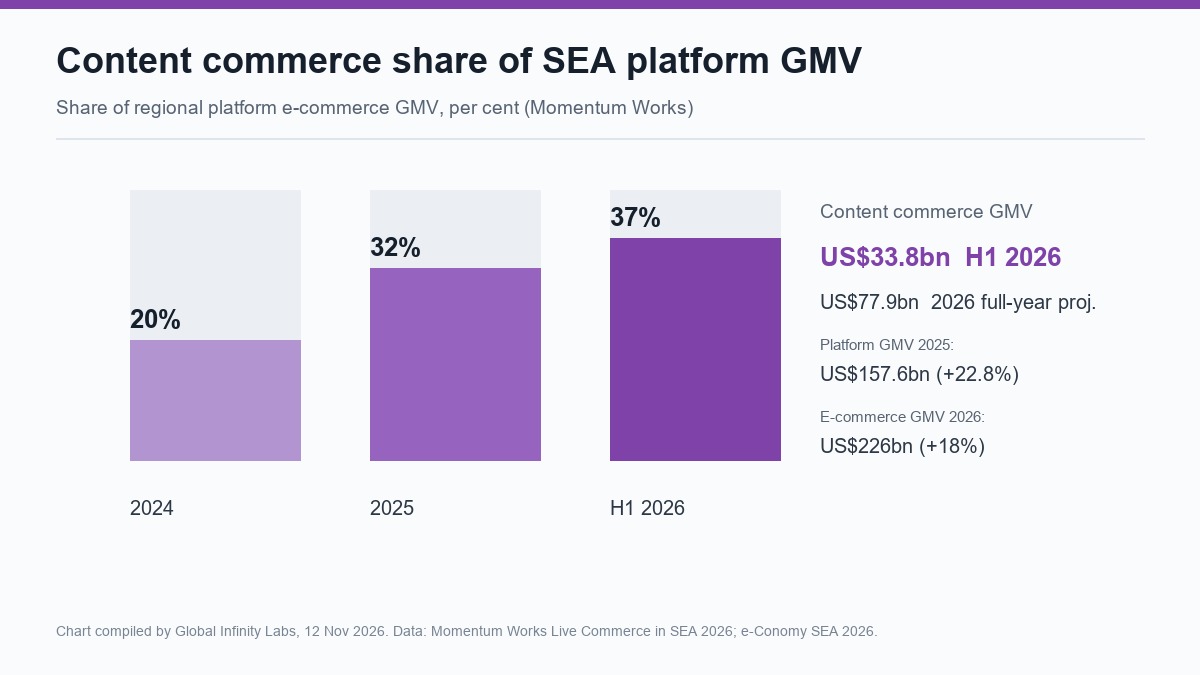
For a team building a 2027 budget, the practical consequence is that southeast asia ecommerce gmv cannot be rebuilt by adding the three channel labels. The US$226 billion line is an economy-wide ecommerce measure. The US$157.6 billion line is platform GMV for 2025 across six markets. The 37 per cent figure is a share of platform GMV in the first half of 2026, up from 20 per cent in 2024. Each carries its own denominator.
What the denominator changes
Three boundaries separate the numbers. The first is coverage: e-Conomy SEA 2026 expanded to ten Southeast Asian economies in this edition, while the Momentum Works platform series covers six markets. The second is period: US$157.6 billion is a full-year 2025 actual, US$33.8 billion is first-half 2026 content commerce, and US$226 billion is a 2026 full-year forecast. The third is the measured object: digital economy GMV also includes online media at US$44 billion, online travel at US$59 billion and transport and food delivery at US$40 billion.
CRN Asia’s 26 October 2026 summary of the eleventh e-Conomy SEA report, published jointly by Google, Temasek and Bain, adds the surrounding categories. Digital financial services gross transaction value is put at US$1.65 trillion, up 16 per cent, with digital lending balances at US$116 billion, up 22 per cent. The same report projects digital economy GMV above US$1 trillion by 2035 and ecommerce at US$409 billion in 2030 and US$820 billion in 2035, implying a compound annual growth rate near 15 per cent from 2026 to 2035. A separate 23 October 2026 account puts 2025 digital economy GMV at US$315 billion and 2030 at US$620 billion. Used carefully, southeast asia ecommerce gmv is a label for three separate series.
None of those lines is a platform channel.
The 37 per cent share is where most misreading starts. Its denominator is platform ecommerce GMV in the first half of 2026, and the numerator is content commerce within that same platform boundary. A reader who divides US$77.9 billion by US$226 billion has mixed a platform subset with a ten-economy ecommerce total. A reader who compares 37 per cent with the 22.8 per cent growth rate has mixed a share with a year-on-year rate. The published material supports a functional conclusion about how discovery happens. It does not support a claim that shelf listings or owned storefronts lost a measurable GMV amount.
This is the first place where southeast asia ecommerce gmv needs a written denominator attached to every use. A share without its base, a half-year figure without its period and a forecast without its scope belong in separate columns of an internal model.
Interfaces, documents and where the money is recorded
Channel labels become operational only at the interfaces. Payment is one. Xendit’s E-comms Momentum Report surveyed 6,000 online shoppers across six markets and found that about 51 per cent of respondents in Indonesia and 41 per cent in the Philippines had abandoned a cart in the previous three months because a preferred payment method was unavailable. On the same platform, QRIS transaction volume grew 142 per cent between January 2025 and April 2026, while QR Ph and InstaPay volumes in the Philippines grew 198 per cent. The report marks these as single-platform data.
Fulfilment is a second interface. Tech Collective’s 2027 outlook says platform commissions, advertising, fulfilment, discounting and returns compress margin, and that profitable growth is taking priority over headline sales. It lists retention, inventory synchronisation and fulfilment efficiency as the areas of focus. Inventory synchronisation is the only published signal in these sources that points at owned storefronts, since a brand running its own site alongside marketplaces needs stock figures that agree across both.
Attribution is the third. An AI-hosted livestream is reported to cost roughly 20 to 25 per cent of a human-hosted stream and to generate about 80 per cent of its GMV per hour. Momentum Works marks those ratios as selected cases without general applicability. The number is useful for a cost model and unusable as a market average. Anyone quoting southeast asia ecommerce gmv in a client deck should attach the coverage line before applying a case-study ratio to a regional total.
The owned-channel gap
No report in the source set publishes a standalone GMV line for direct-to-consumer sites. That absence should be recorded as an absence. Platform share cannot be reverse-engineered to fill it, because a platform share is computed inside the platform boundary and says nothing about sales that never entered a marketplace. The visible signals sit at the payment end, in the abandonment and QR volume figures, and on the merchant side, in the inventory synchronisation requirement.
The gap is a measurement gap. It is not evidence of decline.
For an agency running cross-border brands, the working answer is to keep a fourth column in the model that stays empty until a client supplies its own first-party order data. That keeps southeast asia ecommerce gmv from being presented as a complete channel map when the published material covers platform and content commerce only.
What changes in 2027 planning
The e-Conomy SEA 2026 material records 243 million people using generative AI, equal to 58 per cent of the workforce, with 69 per cent of shoppers using AI to compare complex products and 31 per cent of searches being multimodal. It reports that 75 per cent of AI-using respondents would let an agent find the best price and place an order, subject to safeguards, while 72 per cent already use everyday automation and 62 per cent trust it more than a year earlier. The same survey puts privacy protection at 44 per cent and reversibility at 30 per cent among stated conditions. The ASEAN Digital Economy Framework Agreement is expected in November 2026.
An agent that places an order changes where attribution lands. Discovery, comparison and checkout can happen away from a product page, which makes the interface question a documentation question. Consent settings, reversal rules and an order record a merchant can reconcile become part of the channel definition. None of these figures is a GMV forecast.
Momentum Works’ Ecommerce in Southeast Asia 2026 frames the competitive question as control over demand generation, fulfilment and profit, with 2025 platform GMV close to three times the 2020 level. That framing fits the numbers above. A team that can state which denominator it is using, which period it covers and which interface recorded the sale can compare the three reports without forcing them into one table.
How to read southeast asia ecommerce gmv without a false sum
A practical reading order helps. Start with the coverage line, then the period, then the measured object. Only after those three are fixed does a comparison between two figures mean anything. Label the US$226 billion forecast as ten-economy ecommerce for 2026, the US$157.6 billion as six-market platform GMV for 2025, and the 37 per cent as a first-half 2026 share inside platform GMV.
Then keep the functional map separate from the arithmetic. Shelf search, content discovery and owned storefront retention describe jobs in a chain. The published southeast asia ecommerce gmv figures describe pools of recorded transactions with different boundaries. Adding the three channel labels produces a category error, not a market size.
Finally, carry the gaps forward. No source in this set publishes a standalone owned-storefront GMV line, no source publishes a regional average for AI-hosted livestream economics, and the payment abandonment figures come from a single platform’s survey. A 2027 plan that records those three gaps explicitly will survive the next report release with its denominators intact. That is the useful output of reading southeast asia ecommerce gmv across three different reports.
Sources
- Tech Collective, “5 e-commerce trends to watch in Southeast Asia in 2027” (5 November 2026). https://techcollectivesea.com/2026/11/05/e-commerce-trends-southeast-asia-2027/
- Momentum Works, “Southeast Asia’s content commerce on track to reach US$77.9B in 2026” (8 September 2026). https://thelowdown.momentum.asia/new-report-southeast-asias-content-commerce-on-track-to-reach-us77-9b-in-2026/
- Momentum Works, “Ecommerce in Southeast Asia 2026” (report overview). https://momentum.asia/insights/detail/ecommerce-in-southeast-asia-2026
- CRN Asia, “e-Conomy SEA 2026: Southeast Asia’s digital economy to hit US$368bn” (26 October 2026). https://www.crnasia.com/news/2026/artificial-intelligence/e-conomy-sea-2026-southeast-asia-s-digital-economy-to-hit-us
- Xendit, “E-comms Momentum Report” (survey of 6,000 online shoppers). https://www.xendit.co/en/ecomms-momentum-report/
This article was prepared by the expert team at Global Infinity Labs, drawing on insights and data provided through its MCP data services.
About Global Infinity Labs
Global Infinity Labs is an AI innovation company specializing in MCP data services.
Email: support@globalinfinitylabs.com
To share industry insights, report corrections, or submit story tips: editors@globalinfinitylabs.com or https://www.globalinfinitylabs.com/submit.