Viet Nam’s manufacturing sector posted a purchasing managers’ index of 52.3 in October, up from 51.9 in September and the sixteenth consecutive month above the 50 line that separates expansion from contraction. The headline, however, hides a split that has been widening for most of this year: total new orders keep rising, new export orders keep falling, and October’s overall order growth was the slowest of the entire sixteen-month run. For anyone supplying factories, moving their cargo, or pricing industrial space against them, that split matters more than the headline number.
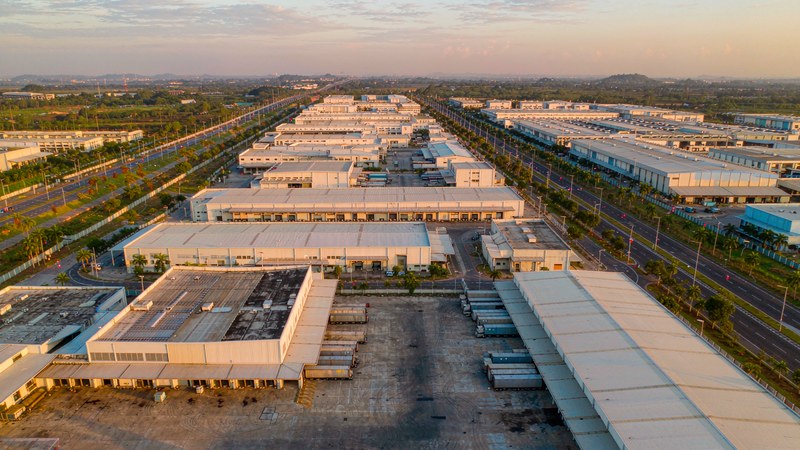
The index itself is compiled by S&P Global Market Intelligence from a monthly survey of around 400 manufacturers, tracking output, new orders, employment, suppliers’ delivery times and inventories. A reading above 50 means conditions improved compared with the previous month; it does not measure how much output grew. On that basis, October was a month of improvement, but of improvement under strain.
The order book is running on two tracks
Total new orders rose for the sixth consecutive month, supported by firmer customer demand. The pace, though, slipped to a six-month low because export orders kept falling. That leaves manufacturers with two different demand signals at once: domestic and regional orders coming in, and overseas customers trimming what they place. Production followed the same shape, expanding for a sixth month but at the weakest rate of the whole run, with several firms citing difficulty obtaining raw materials as the binding constraint rather than demand.
Employment moved the other way. Staff numbers fell for the third month in a row, which the survey attributes to resignations rather than redundancies. That is a mild signal, but it cuts against the idea of factories racing to add shifts; operators are holding headcount flat and squeezing more from existing teams while order growth is thin.
Costs and delivery times are tightening at the same time
Input cost inflation accelerated for a second month and reached its fastest pace since June, driven mainly by fuel and transport charges as oil prices climbed. Supply chains showed the strain in parallel: suppliers’ delivery times lengthened to the greatest extent since April, with companies pointing to higher fuel expenses and poor weather as the causes of transport delays. Manufacturers responded on two fronts. They passed some of the burden on, raising output prices at a sharper pace than September’s slight uptick, and they bought ahead, with purchasing activity rising even as stocks of purchased items fell solidly because inputs were consumed or delayed faster than they arrived.
The squeeze is not uniform across the market. Backlogs of work fell modestly as softer order growth allowed firms to catch up, and stocks of finished goods also declined, though less steeply than in September. In plain terms: factories are not drowning in unsold inventory, but the cost of getting materials in and goods out is rising faster than at any point since mid-year.
Where the new capacity is going
The survey captures existing factories. The investment pipeline points the other way, toward a much larger build-out. Registered foreign direct investment reached USD 54.85 billion as of 31 October 2026, up 74 percent year on year and the highest level since 2009, according to the Ministry of Finance’s National Statistics Office. Newly licensed projects totalled 3,478, with registered capital of USD 30.73 billion, more than double the value recorded a year earlier in capital terms.
The sector split of that pipeline is unambiguous. Processing and manufacturing took USD 14.61 billion of newly registered capital, or 47.5 percent of the total, followed by transportation and warehousing with USD 5.15 billion, or 16.7 percent. A further 1,079 existing projects registered additional capital of USD 16.13 billion, up 33.2 percent, and combined new and additional capital reached USD 46.86 billion, of which manufacturing again accounted for 51.6 percent and real estate 15.1 percent.
Among the 80 countries and territories with newly licensed projects, Singapore led with USD 9.52 billion, 31 percent of newly registered capital, and South Korea followed with USD 5.81 billion. Luxembourg registered USD 4.99 billion and Hong Kong (China) USD 3.57 billion. Mainland China followed with USD 2.77 billion and Japan with USD 1.58 billion.
Disbursed capital, the money actually spent, reached an estimated USD 24.08 billion for the first ten months, up 13.1 percent and the highest for the period in five years. Manufacturing absorbed USD 19.96 billion of that, or 82.9 percent, with real estate at USD 1.76 billion and electricity, gas and air-conditioning supply at USD 785.2 million. Geographically, Ho Chi Minh City led newly registered capital with more than USD 10.3 billion across 1,761 new projects, and Thai Nguyen province ranked second with more than USD 5.8 billion.
Registered capital is not spent capital
The gap between the two FDI numbers deserves as much attention as either of them. Registrations jumped 74 percent while disbursement rose 13.1 percent; the pipeline is filling much faster than the construction. Some of that gap is normal, since large projects register capital years before it flows, and some of it will simply be scheduling. But it does mean the 74 percent figure is a statement of intent, not of capacity already operating.
For equipment vendors, contractors and industrial landlords, the dependable number is the disbursed one: USD 19.96 billion into manufacturing over ten months is money already converted into factories, machinery and fit-out. For freight forwarders and 3PLs, the 16.7 percent of new registered capital going into transportation and warehousing signals that logistics capacity is being planned alongside the plants, not after them.
What the divergence means for operators
Put the two datasets together and a coherent picture emerges. Existing manufacturers are holding a long expansion together while export demand sags and input logistics get harder. New investors, meanwhile, are committing record capital to add manufacturing capacity, overwhelmingly so: more than four in every five disbursed dollars went into factories.
The friction between those facts is where the commercial risk sits. Firms already report difficulties importing and exporting products, and October’s supplier delays were the worst in six months. Every additional billion of disbursed capital increases demand for imported inputs, port slots, inland transport and warehouse space in a system that is already slowing under fuel costs and weather. Capacity that arrives faster than logistics can absorb will dilute the margins the PMI respondents are already defending through higher output prices.
The split also argues for watching different numbers depending on where you sit. Freight forwarders and port operators should track the disbursed-capital line and the monthly PMI delivery-times sub-index together, since both point the same direction at present: more cargo entering the system, moving through a network whose suppliers are already late. Industrial landlords and site selectors, meanwhile, can read the 16.7 percent of new registered capital heading into transportation and warehousing as a lead indicator of where logistics facilities will be requested next, and price land accordingly before the requests arrive. Equipment and component vendors have the simplest read: with 82.9 percent of disbursed money going into manufacturing, the customer base is growing on a schedule they can follow in the statistics office’s monthly release rather than in rumor.
None of this reads as a downturn. Twelve-month output optimism climbed to an eight-month high in October, on hopes of better raw material availability and improved market conditions, even though confidence remains below its pre-war levels in the Middle East. The realistic reading for operators is that demand is not the problem to solve in the coming quarters; input logistics and delivery reliability are. Suppliers who can guarantee material flows, and logistics providers who can hold transit times steady while volumes build, are positioned to take share from rivals whose pricing ignores those frictions.
Sources
- S&P Global Market Intelligence 🔗, “PMI, Purchasing Managers’ Index – Manufacturing, Services” (October 2026 results hub): Viet Nam Manufacturing PMI at 52.3 in October, a two-month high, within the 16-month expansion run.
- VnEconomy 🔗, “Vietnam’s manufacturing PMI ticks up to 52.3 in October” (2 November 2026): order growth at a six-month low on falling export orders, input cost inflation the fastest since June, supplier delays the greatest since April, employment down for a third month, and twelve-month optimism at an eight-month high.
- VietnamPlus (VNA) 🔗, “Vietnam’s 10-month FDI inflows post strongest growth since 2009” (3 November 2026): registered FDI of 54.85 billion dollars as of 31 October 2026, up 74 percent, with processing and manufacturing at 47.5 percent of new registered capital and 82.9 percent of disbursed capital.
- Bao Chinh Phu (Government News) 🔗, “Viet Nam’s 10-month FDI inflows reach over US$54 billion” (4 November 2026): National Statistics Office figures on 3,478 newly licensed projects, additional capital up 33.2 percent, and disbursed FDI at a five-year high of 24.08 billion dollars.
This article was prepared by the expert team at Global Infinity Labs, drawing on insights and data provided through its MCP data services.
About Global Infinity Labs
Global Infinity Labs is an AI innovation company specializing in MCP data services.
Email: support@globalinfinitylabs.com
To share industry insights, report corrections, or submit story tips: editors@globalinfinitylabs.com or https://www.globalinfinitylabs.com/submit.